
In Part I of this two-part series, we established the importance of keeping track of the current turn number, and explored some practical uses of hypergeometric distribution during gameplay.
In Part II, we’re going to extend this power to our deckbuilding.
By the end of Part II, you’ll:
- Understand deck composition probability in order to analyze your own lists and make mathematically informed refinements that go beyond your intuition.
- Have a better handle on how your sideboard is assembled and how your swaps may be unintentionally hindering you.
In a Nutshell
Essentially what we will be doing throughout this process is identifying various groupings of cards that we believe to be relevant for our deck, and then using a hypergeometric distribution calculator (like this free one) to see how likely it is that we would draw a certain number of those types of cards. There are lots of angles we can take to this approach, though.
As a quick review, in order to use hypergeometric distribution we need to know four pieces of information:
1. Total population size (how many “unseen” cards in our deck)
2. Total items of interest in the population
3. Sample size (4 cards that we draw each turn)
4. The number of successes we’re looking for in our sample
Art or Science?
Deckbuilding is an art, but it’s also a science. In the end, I personally believe it is more science than art, given that cards are ultimately just bundles of numbers that adhere to game rules (more numbers), and these rules and systems (more numbers) can be optimized. But game philosophy aside, it’s clear that we should pay attention to the underlying math of cards and deck composition when we’re looking to refine a deck to its maximum potential.
That being said, the idea for a deck doesn’t begin as science. It comes from a more creative, intuitive, and artful place. But once we’ve assembled that initial spark of an idea into its first iteration, we can immediately start putting our decklist through these calculations to get a better idea of where it’s falling short.
The Sweet Spot: Some Baseline Numbers
Most people think about deck distribution using simple division. If I have 3 copies of a card in my 60 card deck, I have a 5% chance of drawing it. That’s true… if you’re drawing only 1 card. But due to the fact that we draw multiple cards at a time (4 every turn), and the probability of drawing a given card changes with each subsequent card drawn, we need a more complex mathematical solution to come to the correct probability. And that’s exactly what hypergeometric distribution does for us.
So - let’s explore some baselines.

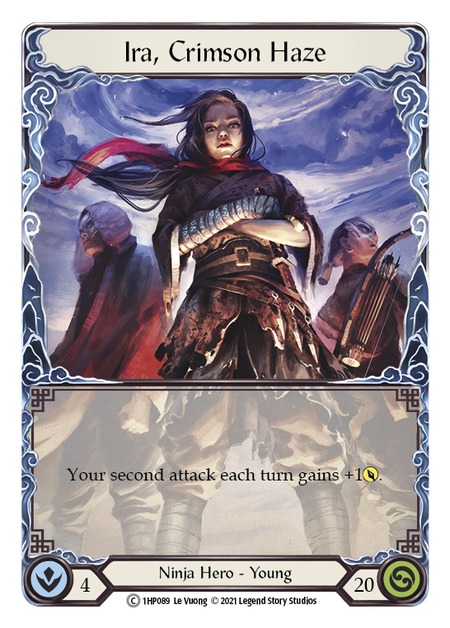
Let’s say I’m playing Blitz Ira. A common, generic play pattern for her is:
- pitch a 0 cost blue
- Kodachi for 1
- Kodachi for 2
- 0 cost attack with Go Again
- 0 cost attack with Go Again
- 1 cost attack finisher
In order to unlock this play pattern, I optimally want 1 blue per hand. I could have more than 1 blue, assuming it’s an attack or buff that I can do something offensively with, but too many blues and I’ll be diluting my offensive potential. Not enough, and I lose out on my Kodachis and have to either pitch a red just to play a non-0 cost card, or just tuck that 1-cost red into arsenal and hope I can pay for it later.
So how many blues should I put in my 40 card deck?
Let’s start by trying 1/3 of our deck, or 12 cards, as blues. Plugging the numbers into the hypergeometric distribution calculator, we see that the chances of getting exactly 1 blue is 43.01%. The cumulative chance of getting 1 or more blues from a 4 card draw is a whopping 77.59%, and the cumulative chance of getting no blues is 22.4%. Do we feel good about this? We don’t even have a 50% shot at getting exactly 1 blue in hand. At first blush, that doesn’t seem optimal.
Let’s play with the numbers a little. What happens if we go up to 20 blues? Our chances of drawing exactly 1 blue plummet to 24.94%. Wow! We just made things a lot worse. Perhaps we need to actually remove blues if we want to try and improve our chances. How about 10 blues? 44.42%. Slightly better!
It turns out, the absolute best we can do to try and draw exactly 1 blue each turn is to run 10 blues in our deck.
But wait! How does this affect our cumulative probability of drawing no blues? It increases it from 22.4% to 29.98% - an undesirable side effect. Not good!
Are we comfortable with this trade-off? By reducing our total blue count, we have slightly increased the chances that we draw exactly 1 blue (the optimal turn!), but at the cost of a significant increase that we may draw none! How bad would that be for us on a given turn, given the rest of our deck construction? Is this the right call? The answer to these questions will depend on a collision of many of other deck factors. This is just one angle of light refracting through the prism that is our deck. As we look at more and more angles, a human will ultimately have to make a decision. And that’s starting to feel a little bit more like art again, isn’t it?
Reverse Engineering
Rather than spending our time building a deck from scratch, I think it would be valuable to assess a professional decklist and try to see why it works. I’m going to use a recent Lexi, Livewire Road To Nationals decklist by Yuki Lee Bender. I’ve chosen this deck because Lexi is a nice complicated build with lots of angles to examine, and Yuki has put together a great decklist.
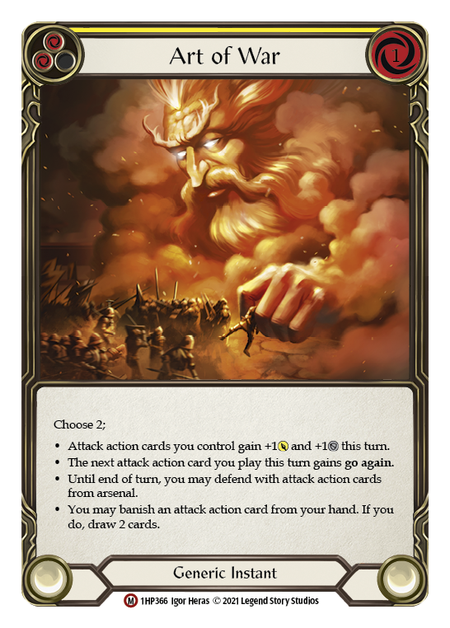
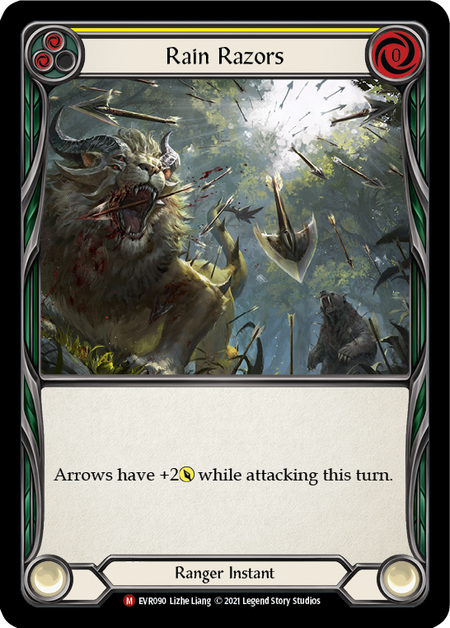
Before we get to the breakdowns, a quick summary of this deck’s strategy. It’s a very aggressive deck that wants to be applying continual disruption through some of its Ice cards and Elemental on-hit effects. The deck does not want to commit cards to raw defense, but hopes to weaken the opponent’s offensive capability via disruption, always trying to play full 4 card hands. Its offensive ceiling is trying to set up a big turn using combinations of Rain Razors + Three of A Kind + Art of War, drawing a bunch of cards (hopefully arrows and blue pitch resources), buffing all arrow attacks, and going wide shooting as many arrows as possible.

Step 1: Take Inventory
I find it helpful to list out all the groupings of cards that we feel are relevant to our deck, and simply count the main board and sideboard totals.
The groupings I always take inventory of are resources (reds, yellows, and blues), card cost (0, 1, 2, etc.), card type (attack, non attack, instant, etc.), and traits (Elemental, Ice, Arrow, etc, if they apply to the deck's strategy). Lastly, we want to count how many “additional effects” we care about. For example, if you’re playing a go-wide attack action deck, you want as much unconditional Go Again as you can muster. Or if the Illusionist matchup is a struggle for you, count how many 6 attacks you have to pop their Phantasm attacks. If you’re Levia, you need to count your Blood Debt cards. Every deck will care about different things.
You can launch straight into running calculations, but I find it’s best to assemble a “real” deck by adding in enough sideboard cards to get to 60+ first. That way our probabilities are based off of a real deck that we would use. For this exercise, I’ll be using Yuki’s “aggro” package for when we are facing very aggressive decks. So in addition to the 51 main board cards, I’ll be adding in x3 Art of War, x3 Arctic Incarceration (red), and x3 Blizzard Bolt (yellow) for extra disruption.
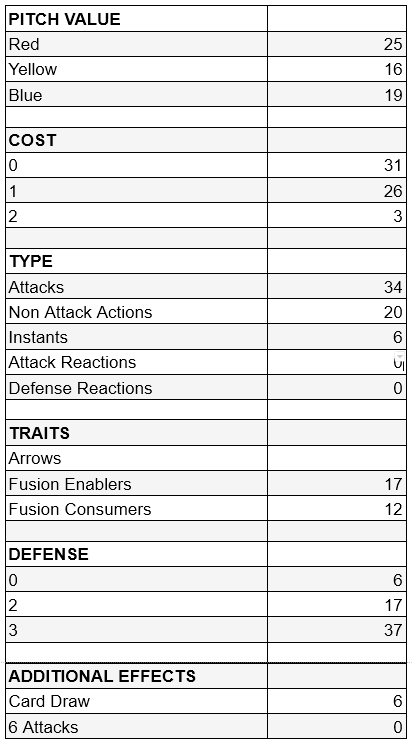
In the end, our numbers look like this:
We can easily add types to this list later as we playtest the deck and uncover other factors we may want to take inventory of. Counting up these types took me about 10 minutes, so the effort is minimal.
Step 2: Run the Numbers
Resources
I like to always begin with assessing the deck’s resource and cost probabilities.
For this deck, we can see that there are 19 main board blues, and no sideboard blues. Similar to the Ira example earlier, we can see that 19 blues gives us a 41.53% chance of getting exactly 1, a 20.76% chance of getting 0, and a 79.23% chance of getting 1 or more. Yuki has opted for this very stable base of blues whose distribution is not affected by sideboarding. Still, these numbers don’t mean much unless we know how much we’re looking to spend each turn, which we’ll get to shortly.
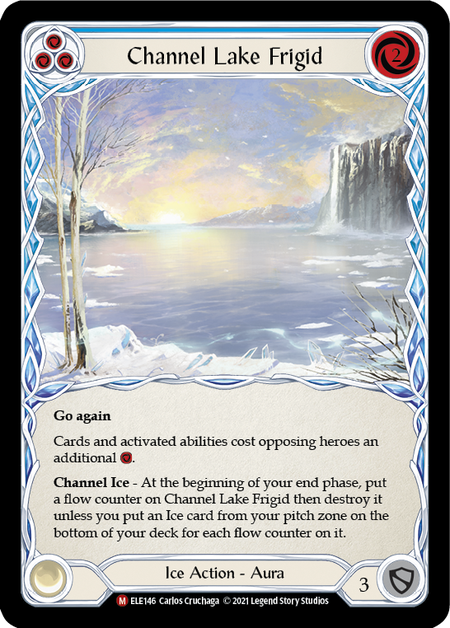
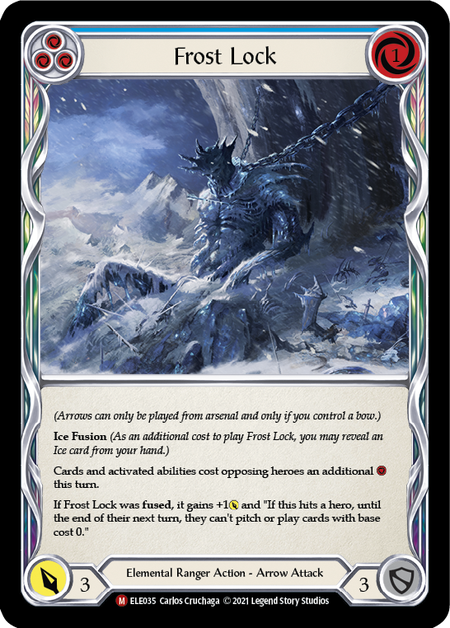
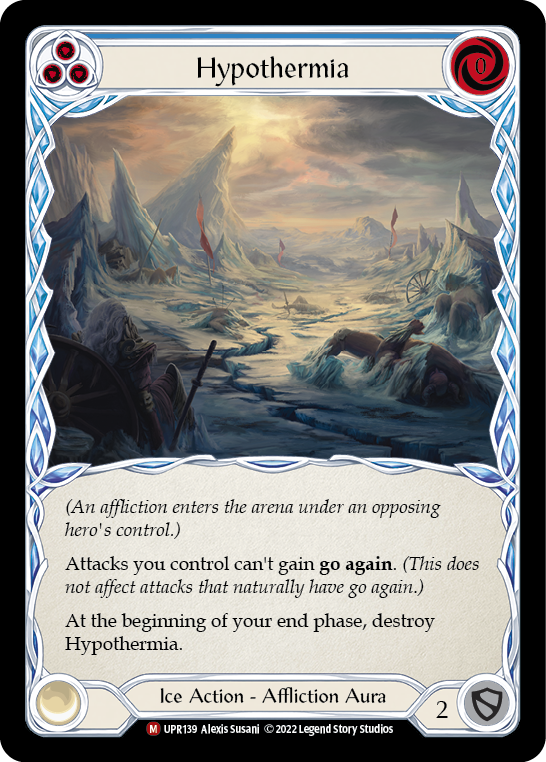
Another question we need to ask is: do I actually want to play these blues? Or are these just for pitching? In our case, we actually do want to play some of these blues. Hypothermia, Channel Lake Frigid, and Frost Lock are notable examples. This is a situation where we could rerun the numbers excluding playable blues to try and get a closer read on our “always resource” blues. For this deck, though, if we only have 1 blue in hand and need it for resources to continue applying pressure, we’ll almost always prefer to pitch it before playing it. Again, without knowing our deck’s cost to play, the resource count is a number without context.
A final consideration on resources: do we have enough to deal with disruption and arcane damage? This can often be handled in your sideboard, as we’ll discuss later, adding blues to account for matchups where Ice tax or must-prevent arcane damage will be present. Again, though, Yuki’s list doesn’t do this; these are the 19 blues we’ve got.
Cost
Developing the most efficient lines of play is a delicate balance. Certain decks will need to milk every point of efficiency they can (think Fai), while others will have a bit more flexibility with their pitch to cost ratios. Lexi has some flexibility, but most turns we’re going to be riding our resources down to exactly 0. And in some cases, we’ll be wishing we had a little more.
Let’s run the numbers. Our deck has 31 0-cost cards, 26 1-cost cards, and three 2-cost cards.
We’re virtually guaranteed a 0-cost card on every turn (95% chance), so we’ll always have something to play, even if we were forced to block to prevent key on-hits.
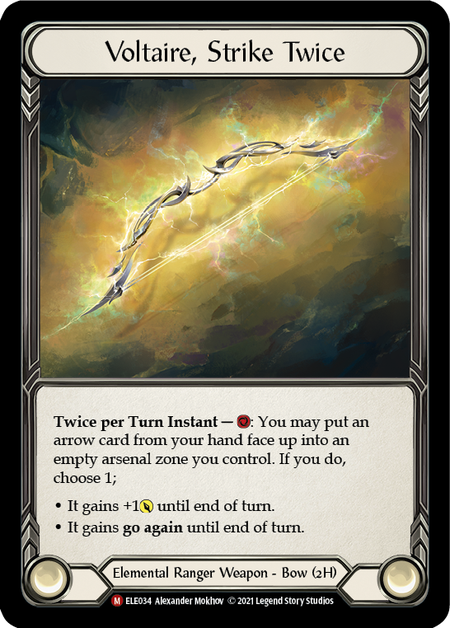
Or are we? This is where we need to be a little careful. These numbers don’t necessarily tell the whole story. You still need to know your optimal lines of play. The majority of these 0-cost cards are arrows. And while they fire for free, they don’t load into your arsenal for free (usually). You need to account for the resource consumption of Voltaire in your pitch and cost distributions.
Of particular help when looking for potential problem areas in our decks is to reference the cumulative probability of drawing 1 or more cards with a higher cost. This is the inverse problem of drawing no blues, instead drawing all your expensive cards at once.
In Yuki’s list, we see that this is pretty unlikely. We only have three 2-cost cards in the deck (Channel Lake Frigid) - and, notably, it’s a blue card. The chances of drawing 2 or more of this single card in hand is .9%. Not a concern. And anyway, if it happens, we can pitch one to play something else! This is another thing to watch out for. These sorts of cards can be false indicators that are, at least to some extent, artificially inflating your Cost metrics. Channel Lake Frigid, in this case, is a blue Ice card that we’re happy to pitch, use to fuse, or block for 3 if we really need to. Playing it is optional.
More probable, though, is drawing a glut of 1 cost cards. With 26 in the deck, the chance of getting a hand with 3 or more 1-cost cards is 21.11%. Luckily, Yuki has assembled a great list that has a great deal of yellows to account for this possibility. This softens the blow on an awkward draw, ensuring that you’ve always got enough resources to fire off at least 1 arrow, applying a little bit of pressure (we’re going to draw an arrow every turn, right?).
The other beautiful part of Lexi is our ability to not feel bad about ending our turn with a card in hand, especially if it’s an Ice or Arrow. We are happy to arsenal. In fact, that’s a core aspect of the deck’s strategy: preloading arrows into arsenal and then using them next turn in addition to the fresh arrows we draw, as well as flipping our Ice cards and generating Frostbite.
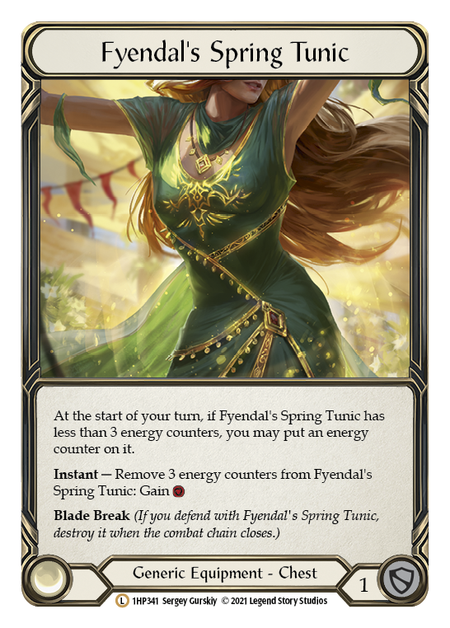
And, lastly, we can’t talk about cost and resources without acknowledging other sources of resource generation. Namely, Fyendal’s Spring Tunic. Every 3 turns, Lexi has an additional resource to play with. You can’t reflect that in the numbers, but it’s critical to remember.
Type
How much attention we pay to our card types distribution will vary based on the deck we’re playing. Runeblade wants an even split between attack and non-attack actions as we noted earlier. Weapon warriors want very few attacks. In Lexi’s case, we care a great deal about ensuring we have attacks- mostly arrows- on every turn.
By jamming our deck with 34 attacks, all of which are arrows, we have a 96.9% chance of getting 1 or more attack every turn. This is critical. What’s better, though, is getting two attacks every turn. Our chances of getting 2+ is still a whopping 78.8%. This is exactly what we want as an aggressive deck. How about 3? A big drop-off down to 41%. Still, we will see a three attack hand in almost every game at that rate.
If we wanted to dig deeper, we could create some “custom” categories such as “0 cost arrow attacks” or, “Yellow pitch attacks.” Feel free to do this if you think that information would be helpful as you’re assessing your deck and looking for swaps. No need in this case, as hopefully at this point you’re seeing how this works.
One final note with card types: be careful with your Instant distribution. They block for 0, so too many can create some bad situations as we’ll see when we consider defense.
Traits
Lexi cares about Elemental fusion and arrows. Other classes care about other traits (Fai and Draconic, for example). We just noted that we have 34 arrows in the deck, more than enough to ensure we can benefit from our Rain Razors combo and never be lacking on offense. So let’s consider Elemental fusion for a moment.
I have chosen to group cards by Fusion “enablers” (almost all Ice cards) and Fusion consumers (almost all Elemental cards looking to Ice fuse). We have 17 Ice cards in the deck, and 12 consumers - all attacks looking to apply additional on-hit disruption.
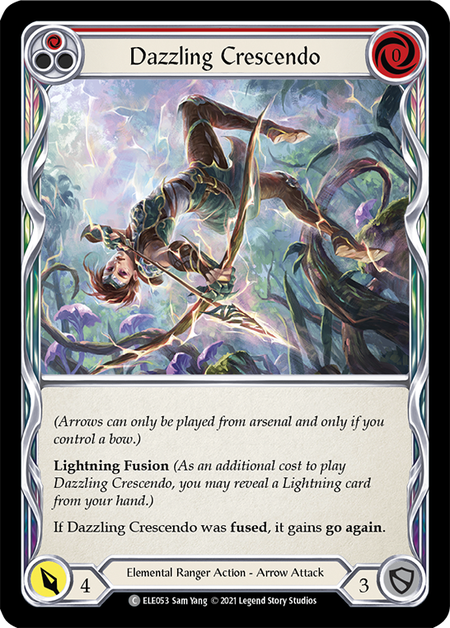
Of note are the 2 copies of Dazzling Crescendo. These are consumers with no enabler. They are in the deck because they’re a 0-cost 4 attack arrow. So, in our case, I’m going to exclude them from the consumer metrics, as we are never intending on fusing them.
These are really great ratios. We have almost 33% more enablers than consumers, giving us a good chance of getting a successful fusion.
The chances of drawing 1+ consumer is 60% while the chances of having 1+ fusion enabler in hand is 74.69%. There’s only a 15% chance that we’d draw more than 1 fusion consumer in a single hand. These are incredibly healthy chances for us. We have the potential for fusion just about every turn.
However, a bit of caution: the numbers can’t tell the complete story here. If one of our fusion enablers is a blue pitch that we need to jettison immediately to start playing our turn, we won’t be able to fuse with it, obviously.
Defense
One way of evaluating a deck’s defensive capability is to calculate the average defense by dividing the number of cards in deck by the total number of defense points. In our deck’s case, that’s 2.41 (60 cards / 145 total defense points).
Getting the average defense is only so helpful, since in a real game, you never have fractional block values. The mathematical term for this is discrete, meaning whole numbers. However, there is some value in assessing the average. It can serve as a “quick and dirty” assessment of how much defense you will be able to muster, on average, from a four card hand. In our case, that’s 9.64. Let’s be pessimistic and round down to the nearest whole number. This deck can only block 9 points of damage per turn, on average, from hand. Not great!
In Lexi’s case, we already know that we really don’t want to be defending. That being said, there are almost always a few key on-hit effects that most matchups will force us to block, and in those moments, we want to block as efficiently as possible. Ice cards often have 2 defense instead of 3, and we are playing quite a few. Let’s look at our distribution, focusing on worst case scenarios, and calculate how likely it is to end up with a hand of all 2 defense or lower cards. That means our 6 instants that block for 0 as well as our 17 2-block cards.
Luckily, despite a heavy concentration, it’s still not that likely that our entire hand is a defensive stinker. Just shy of 2%. But what about drawing three or more sub-optimal defense cards? 15.25%. If a game goes to Turn 7, you just might see it! Unfortunately, this is something we simply have to deal with in our deck. It’s one of Lexi’s weaknesses. We hope that our strengths will compensate.
Additional Effects
The last stop and potentially the most important, this is the “catch all” category for any aspect of our deck that we might care about that isn’t covered. You can get as specific as you want with these groupings. If you’re Boltyn, how many Charge cards do you have? How many 0-cost charge cards do you have? If you’re Iyslander, how many 0-cost blues to play from arsenal? The possibilities are endless and are yours to discover.
In Lexi’s case, since our preferred mode of defense is via applying disruptive offense, it would be useful to know how many of our cards are disruptive. You could even separate into two groups: unconditional disruption and conditional disruption.
For the sake of time, I’ll spare you the specific calculations. But I do want to make one more final observation when it comes to additional effects for Lexi. For our biggest play potential, we are going to be drawing more cards. Three Of A Kind and Art of War are the two ways we can do this, and they’re very powerful cards.
Our chances of drawing 1+ of these accelerators is 35%. Not bad! But once we play one, we are increasing our chances of drawing another accelerator. We can actually calculate the in-game probability of drawing more arrows using the techniques covered in Part I. Let’s do a hypothetical situation to demonstrate.
Let’s say it’s Turn 2, I’ve seen 8 of the cards in the deck, and I get my first Art of War and decide to play it. What are the chances that I draw another card draw accelerator? There are 5 “successes” left in deck, and 52 cards remaining in the population size. I’m going to be drawing 2 cards from Art of War by banishing an attack from hand. Surprisingly, there’s a very optimistic 17.7% chance that I would draw another accelerator. This is our dream scenario! If we can chain these together, we can get some absolutely massive hands. And indeed, this is exactly what our deck is trying to do.
Another common “additional effect” to pay attention to is 6-attack cards. This list has none, so we know we have no easy answers when facing Phantasm attacks. How many would we have to add, and at what cost to our deck’s other metrics, in order to make a difference? This could easily be calculated. Only you can decide if it’s worth it.
Step 3: Honing the Sideboard
How “stable” your core deck is in its card type composition is entirely deck dependent. Some decks have larger, high fluctuation sideboards per matchup, while others stick to their core deck more rigidly, only swapping or adding a few pieces.
Unfortunately, the more you sideboard, the more complicated and variable the calculus. The one thing you can always try to do is to mitigate the “distribution shift” by swapping “like for like” cards- for example, swapping a blue Steelblade Shunt (blue defense reaction) for another blue. You may lose 1 defense reaction, but at least you haven’t shifted your resource distribution. The same could be applied to your Elemental consumers and enablers, etc.
In Yuki’s case, her sideboard is mostly made of additional attacks. Additionally, the pitch values are constrained evenly across Red and Yellow. This is a very clever sideboard that makes it easy to sub in cards to get to 60 without radically changing our resource or card type distributions across matchups.
No doubt, creating a sideboard is perhaps the trickiest part of deck building, but with the power of hypergeometric distribution, you can evaluate the mathematical impact on your deck’s core strategies instead of just going off of gut feel.
Conclusion
We could have run many, many more calculations. Just remember that data is only helpful insofar as you actually take actionable steps with it. As you’re evaluating your own decks, don’t try to do too much too soon. Pick a few aspects of the composition to improve and playtest it. Move through the playtesting rapidly, seeking to answer just a single question about your deck. Then revisit the math and keep moving forward. Take note while you’re playing if something feels bad in a matchup. Then, later, experiment with your distributions to see if you could hypothesize a solution without compromising the existing functional parts of your deck.
This is the dance of deck building and playtesting. Science and art inextricably linked. Good luck!
Background music for audio narration was Decoherence by Scott Buckley | Music promoted by Chosic | Creative Commons CC BY 4.0